MFour Data Research (formerly MFour Mobile Research) is a consumer insights technology company that delivers validated, real-time behavioral and survey data. Through its 4.5-star-rated Surveys On The Go® app, the company combines consumer-permissioned “Fair Trade” data, including web, app, and location activity, with survey responses to provide a deeper understanding of consumer behavior and the full customer journey.
COMPANY
MFour Data Research
SERVICES
Digital Design, Graphic Design, Illustration, Research, Copywriting
YEAR
2020-2025
PROGRAMS USED
Adobe Photoshop, Adobe Illustrator
Project Overview
PROBLEM
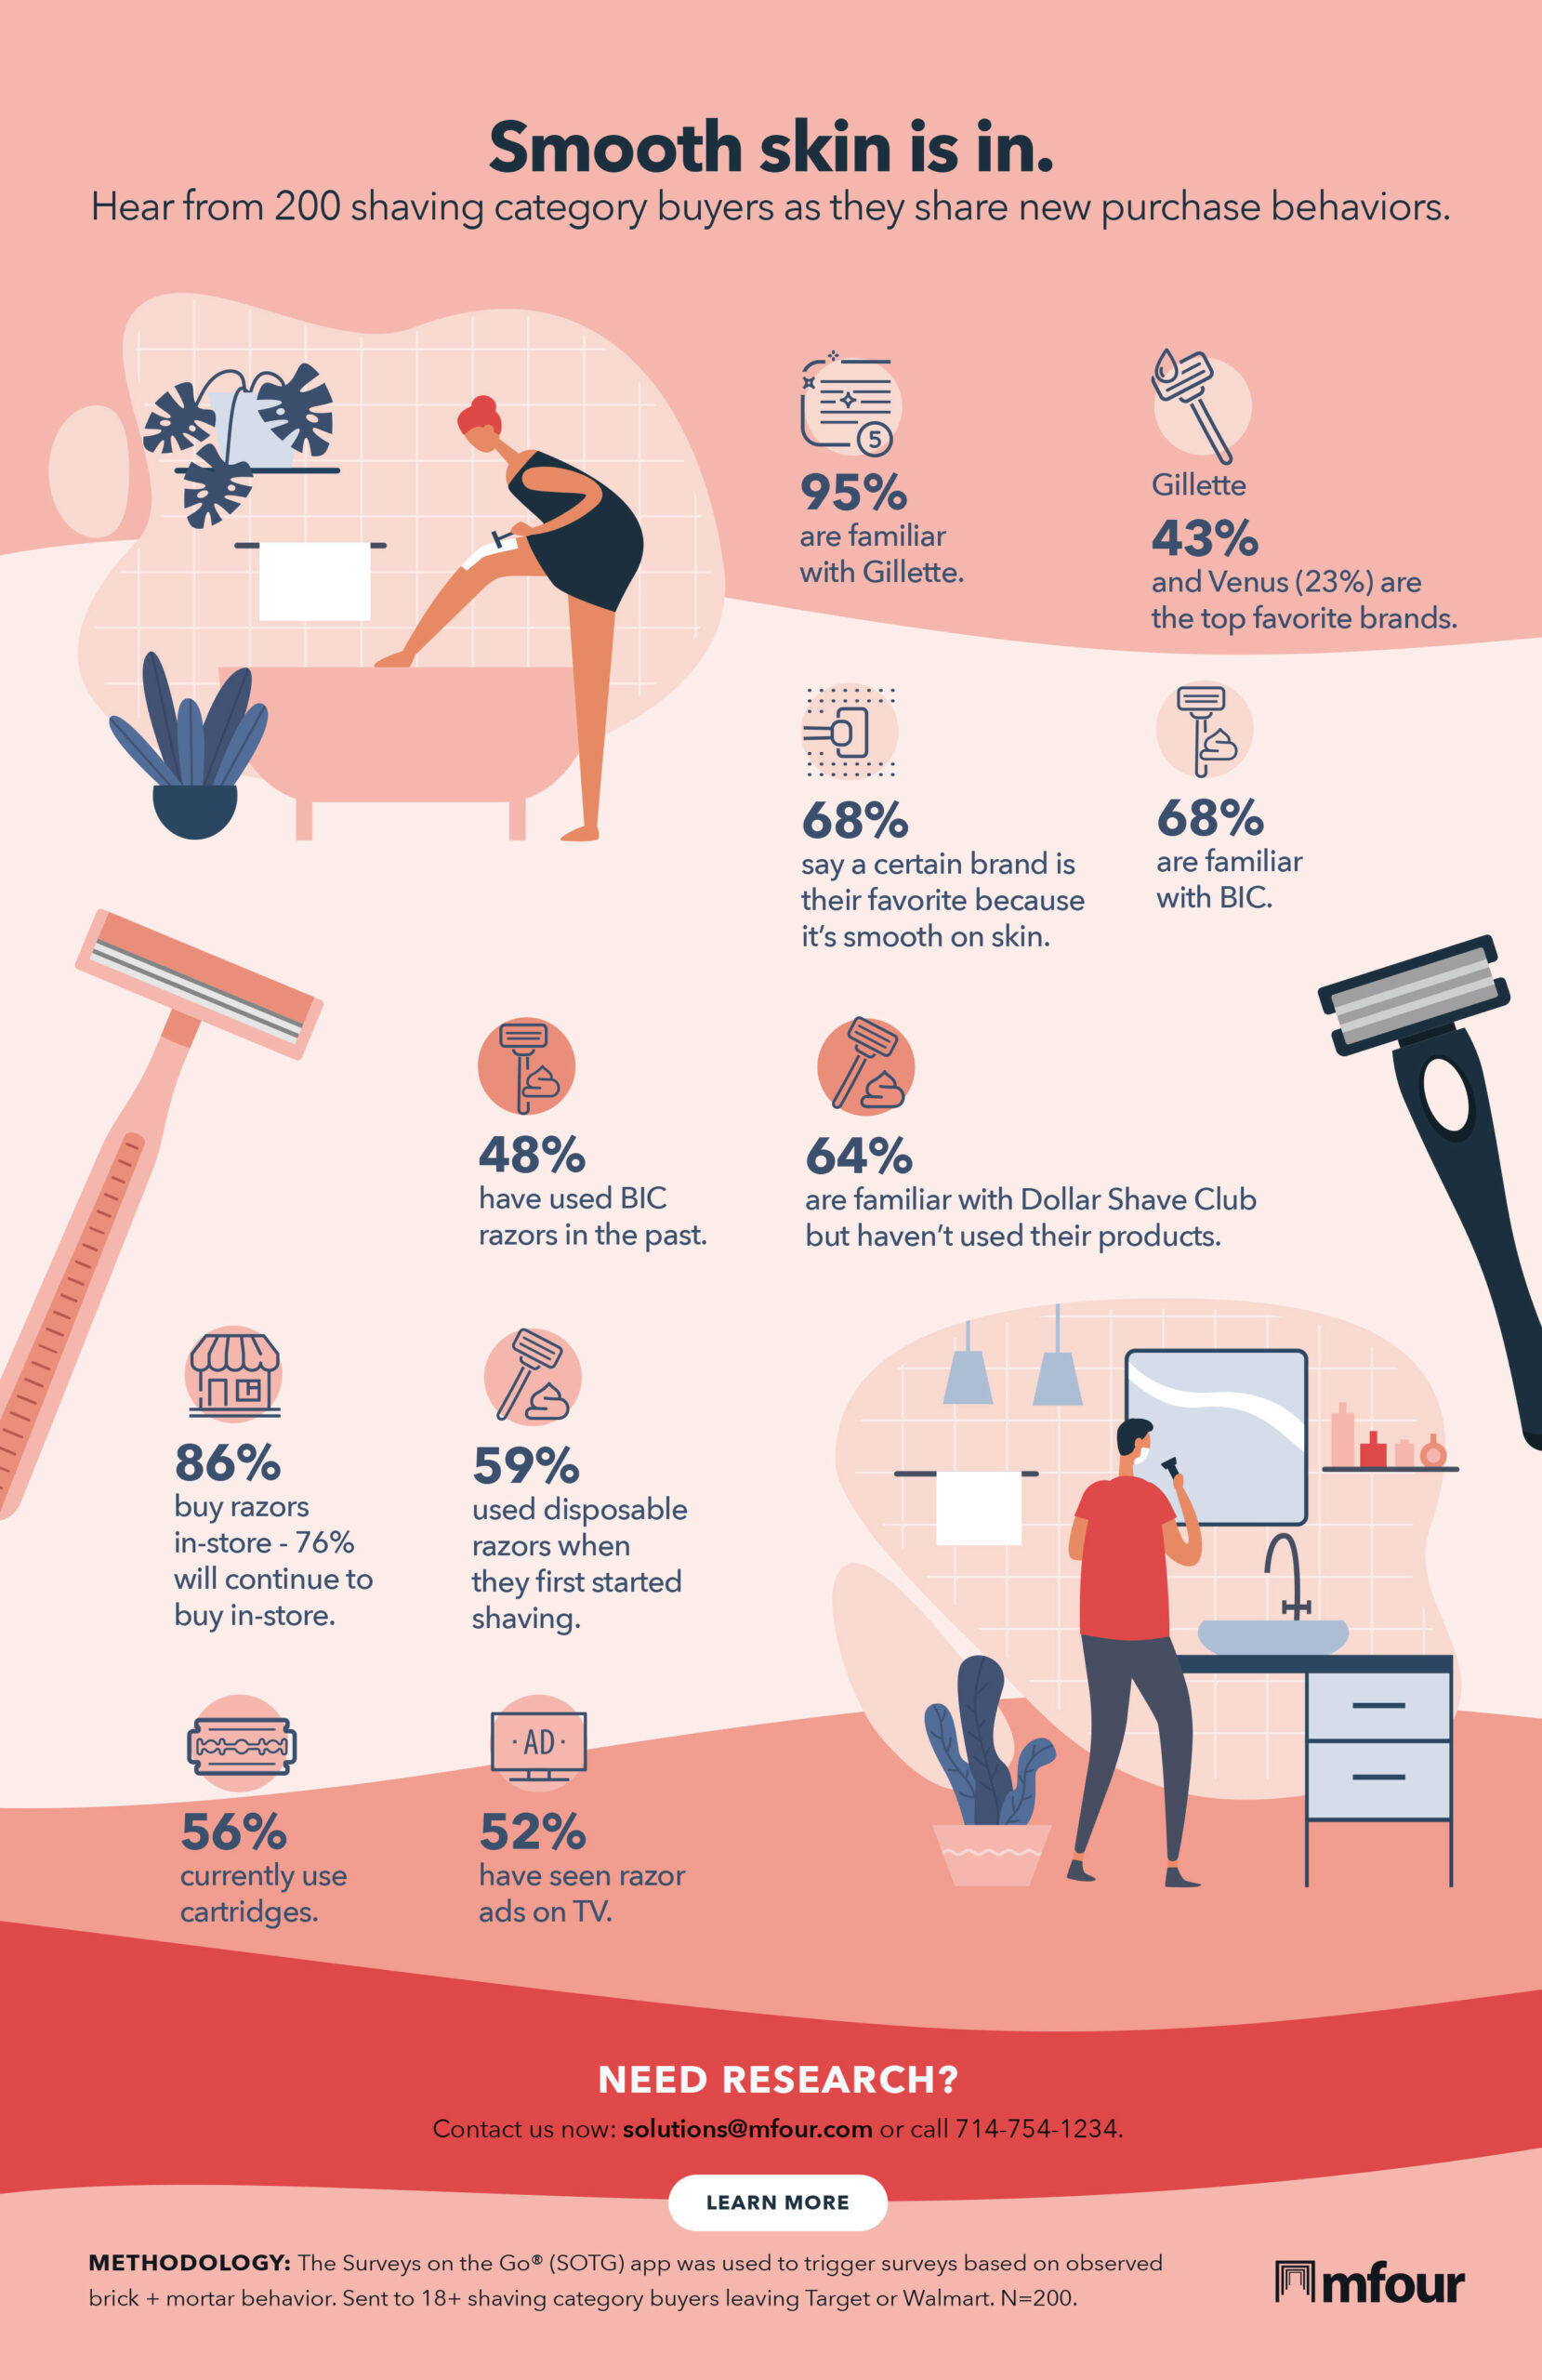
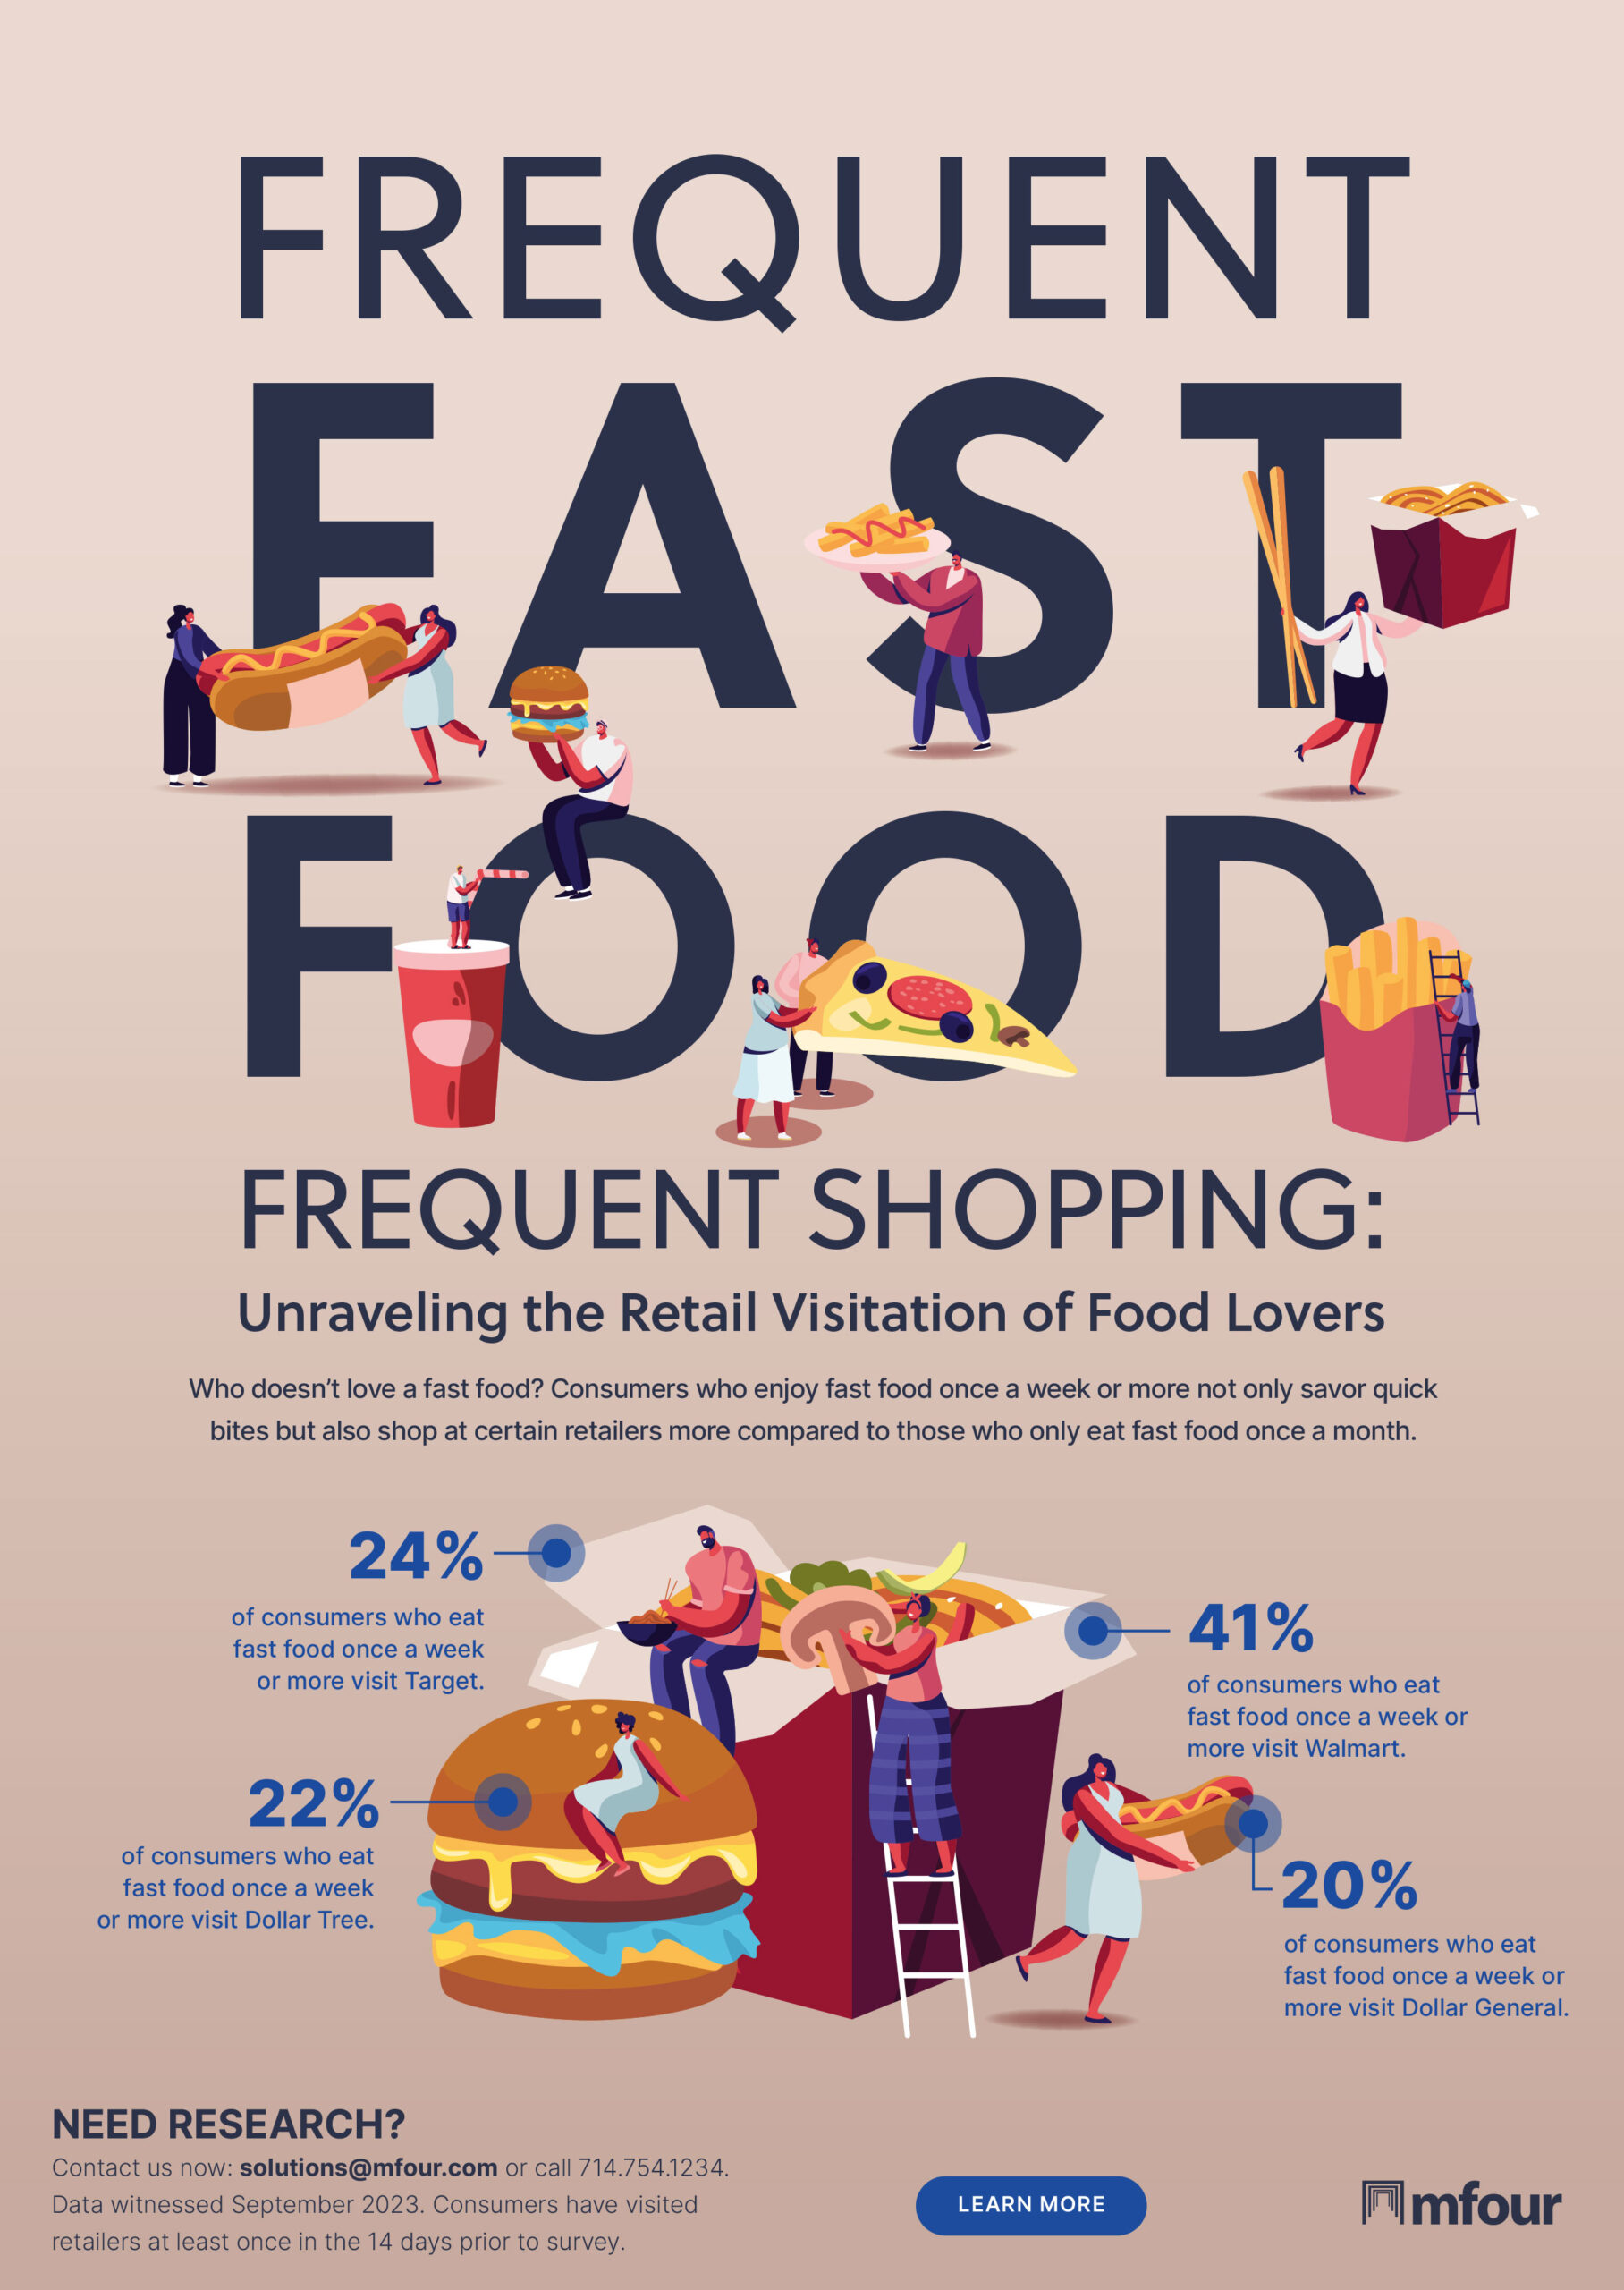
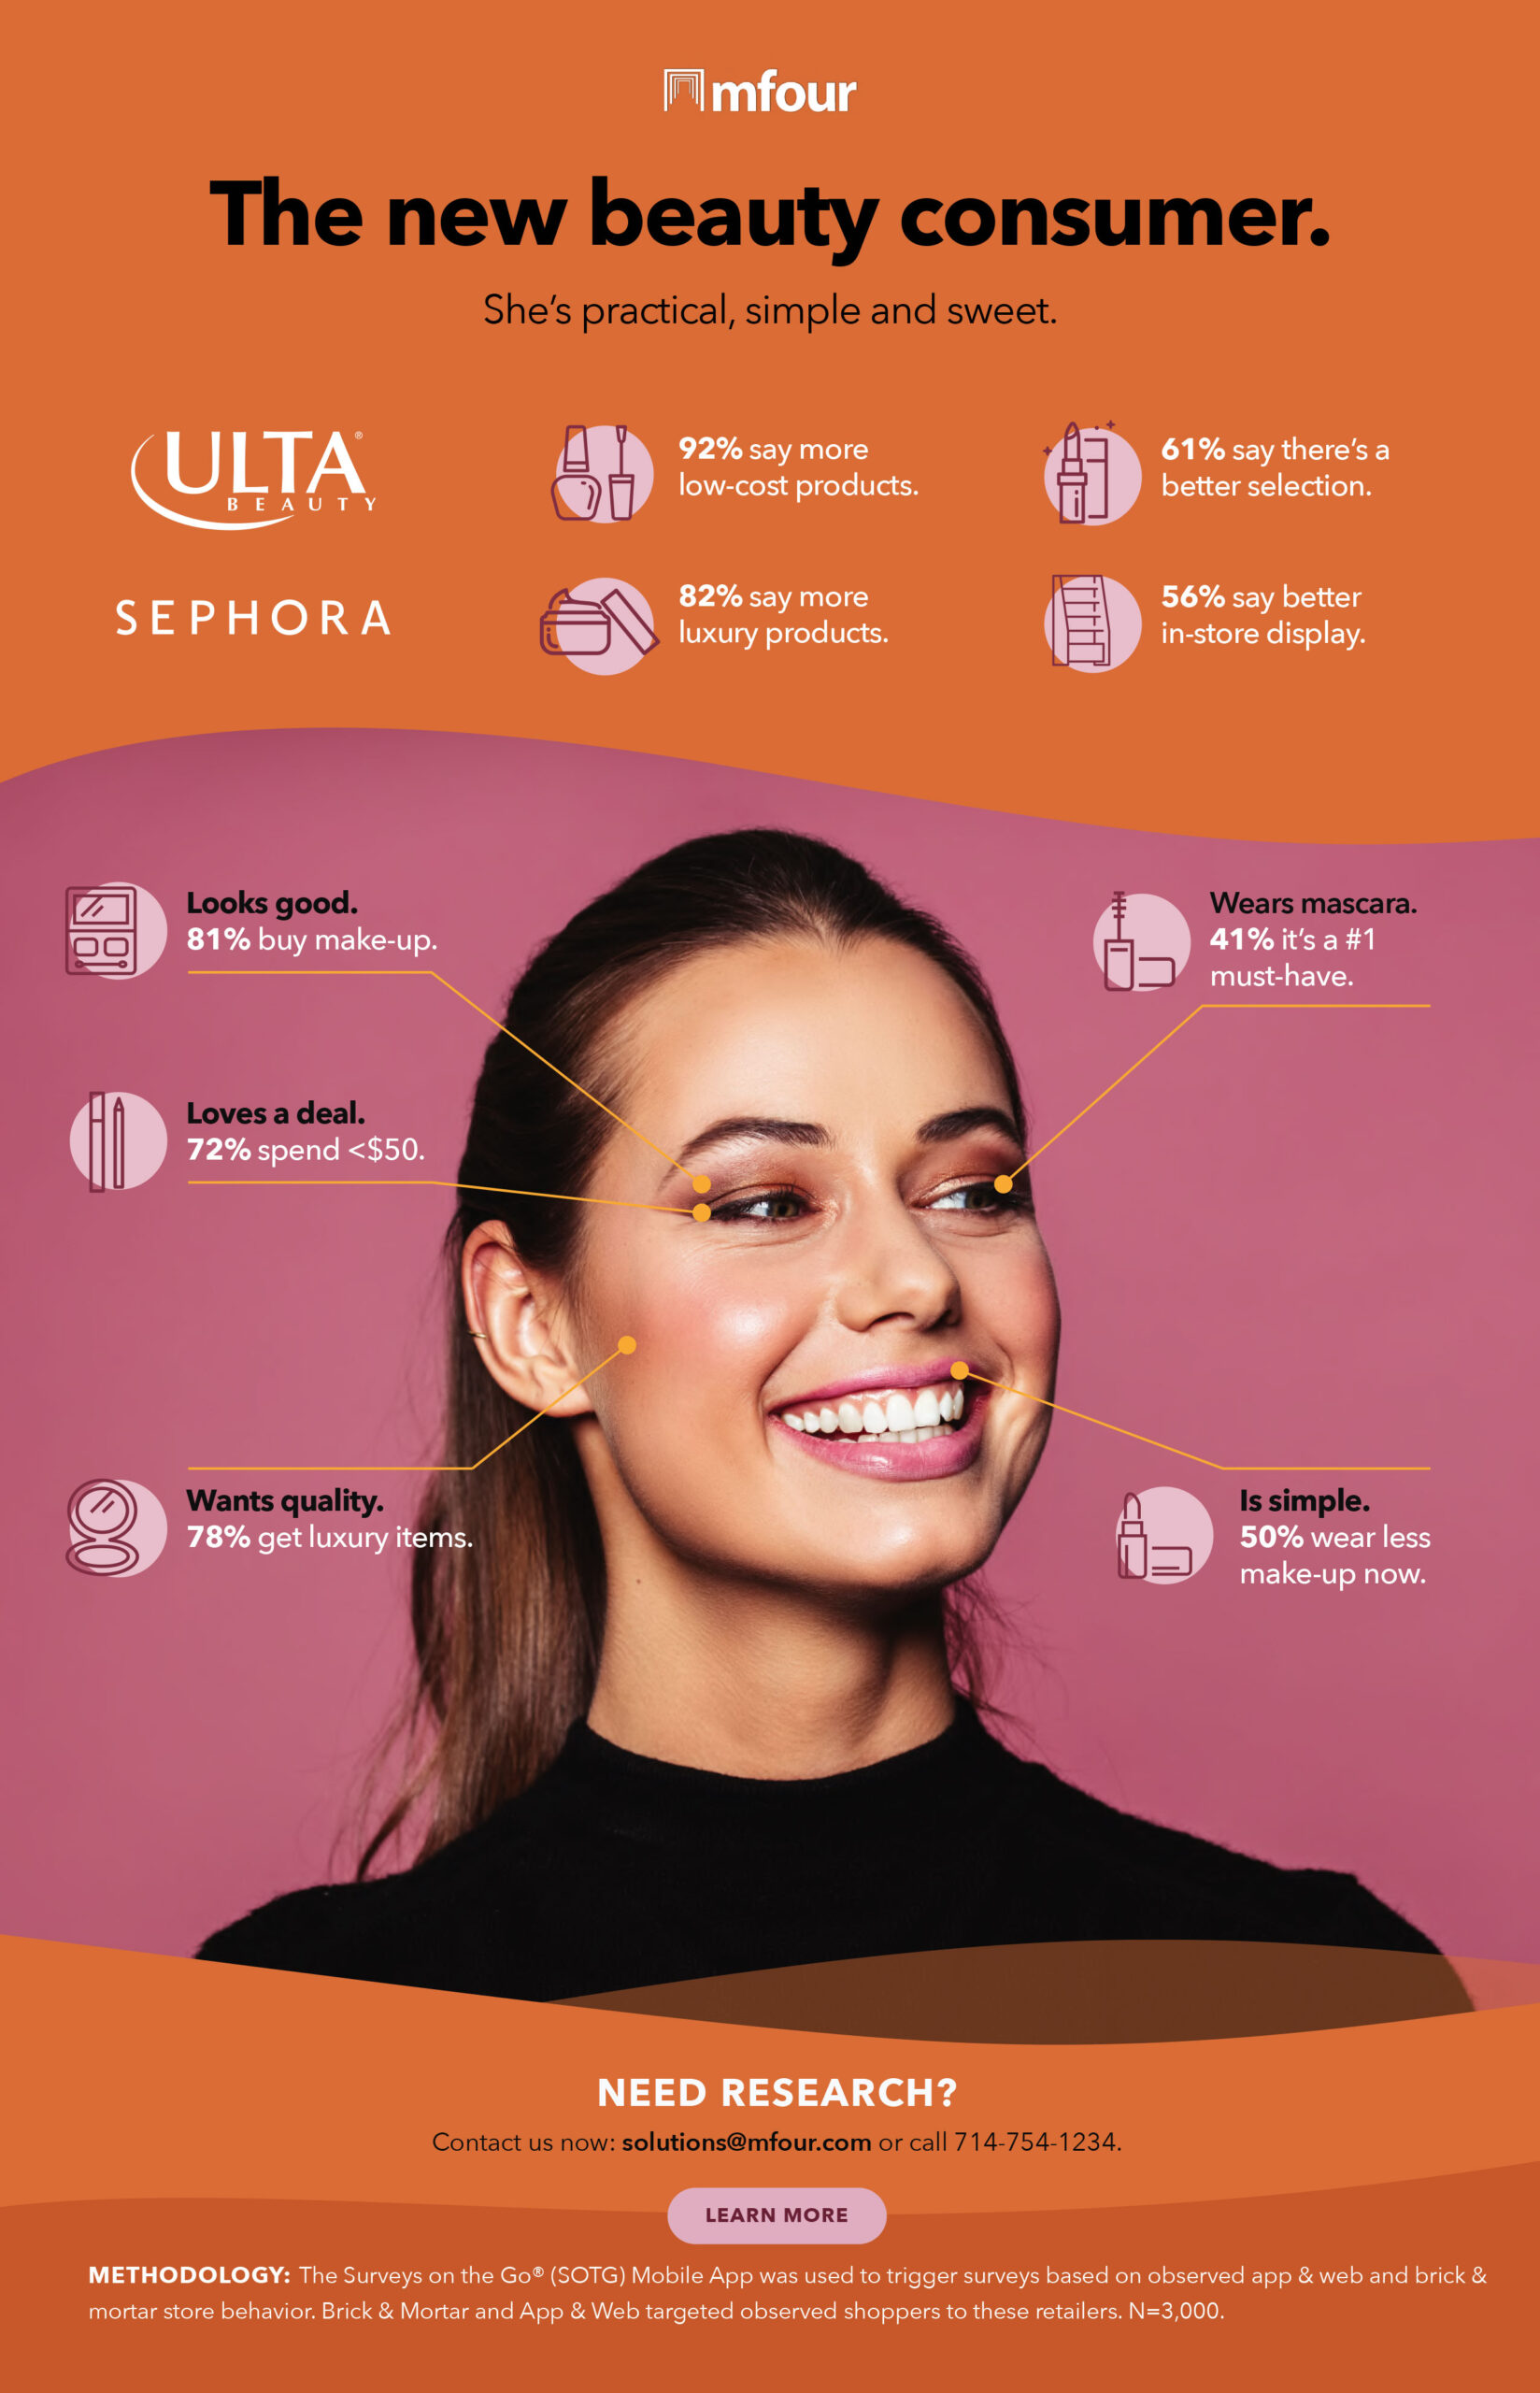
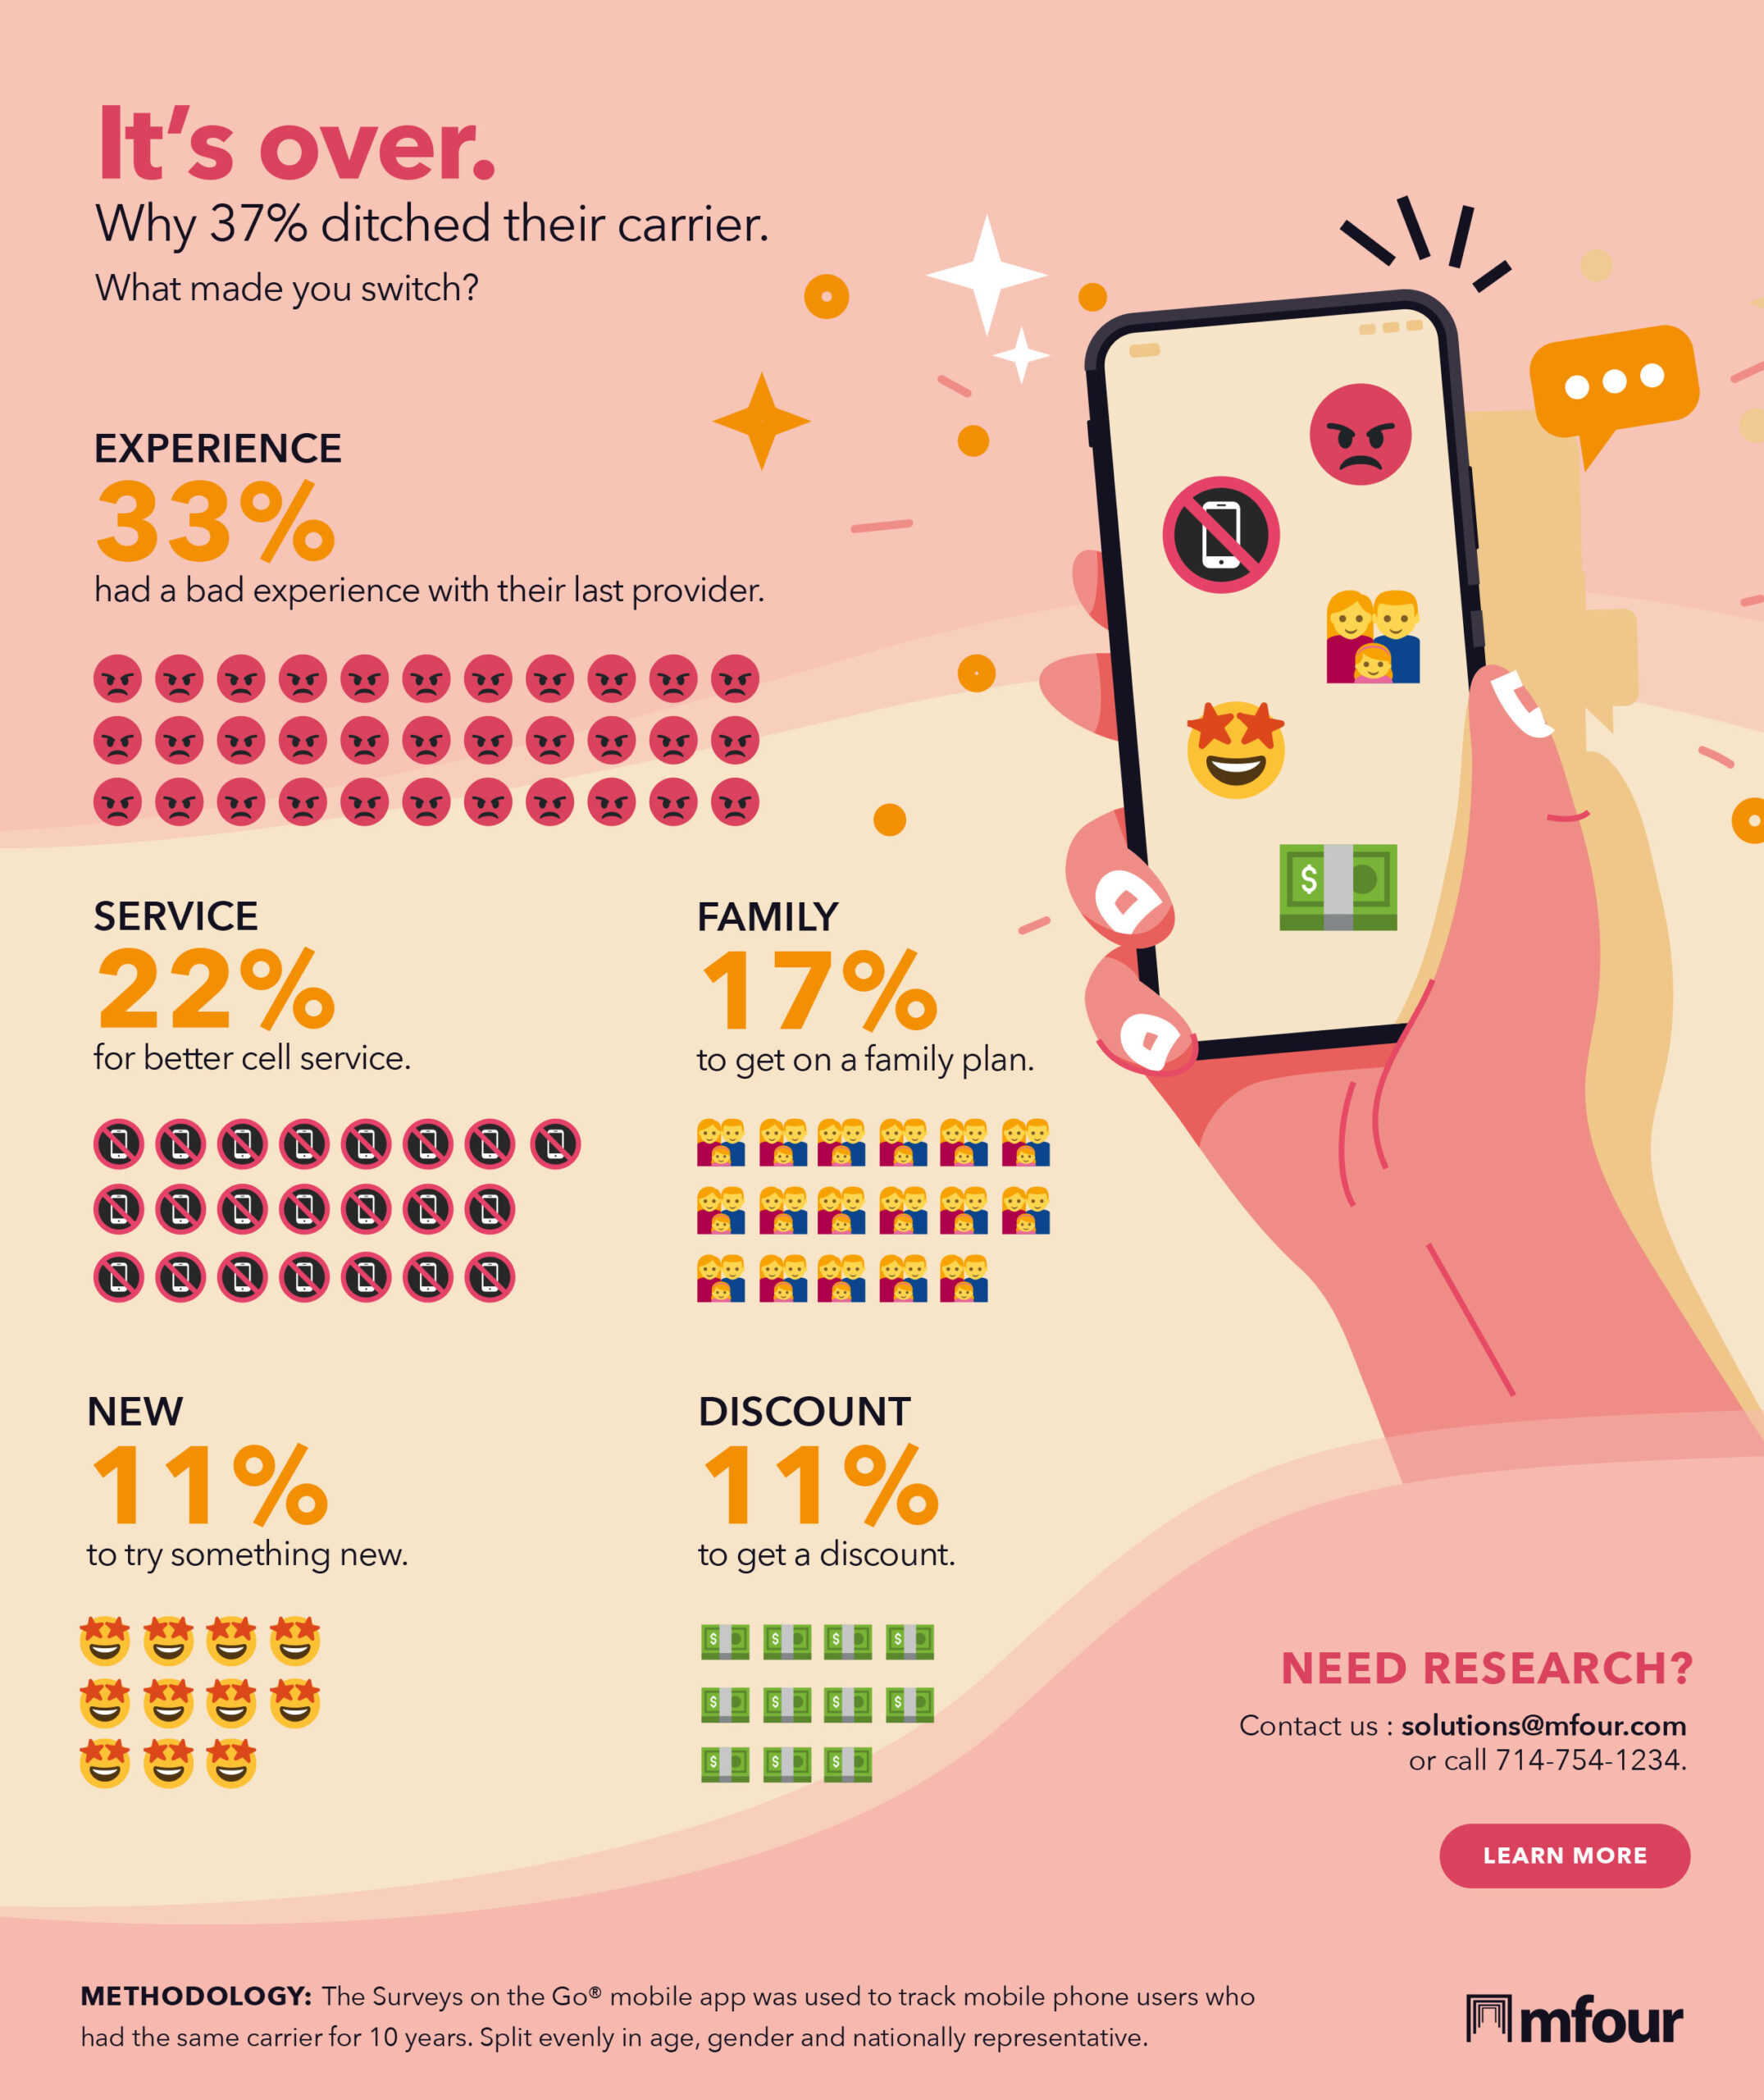
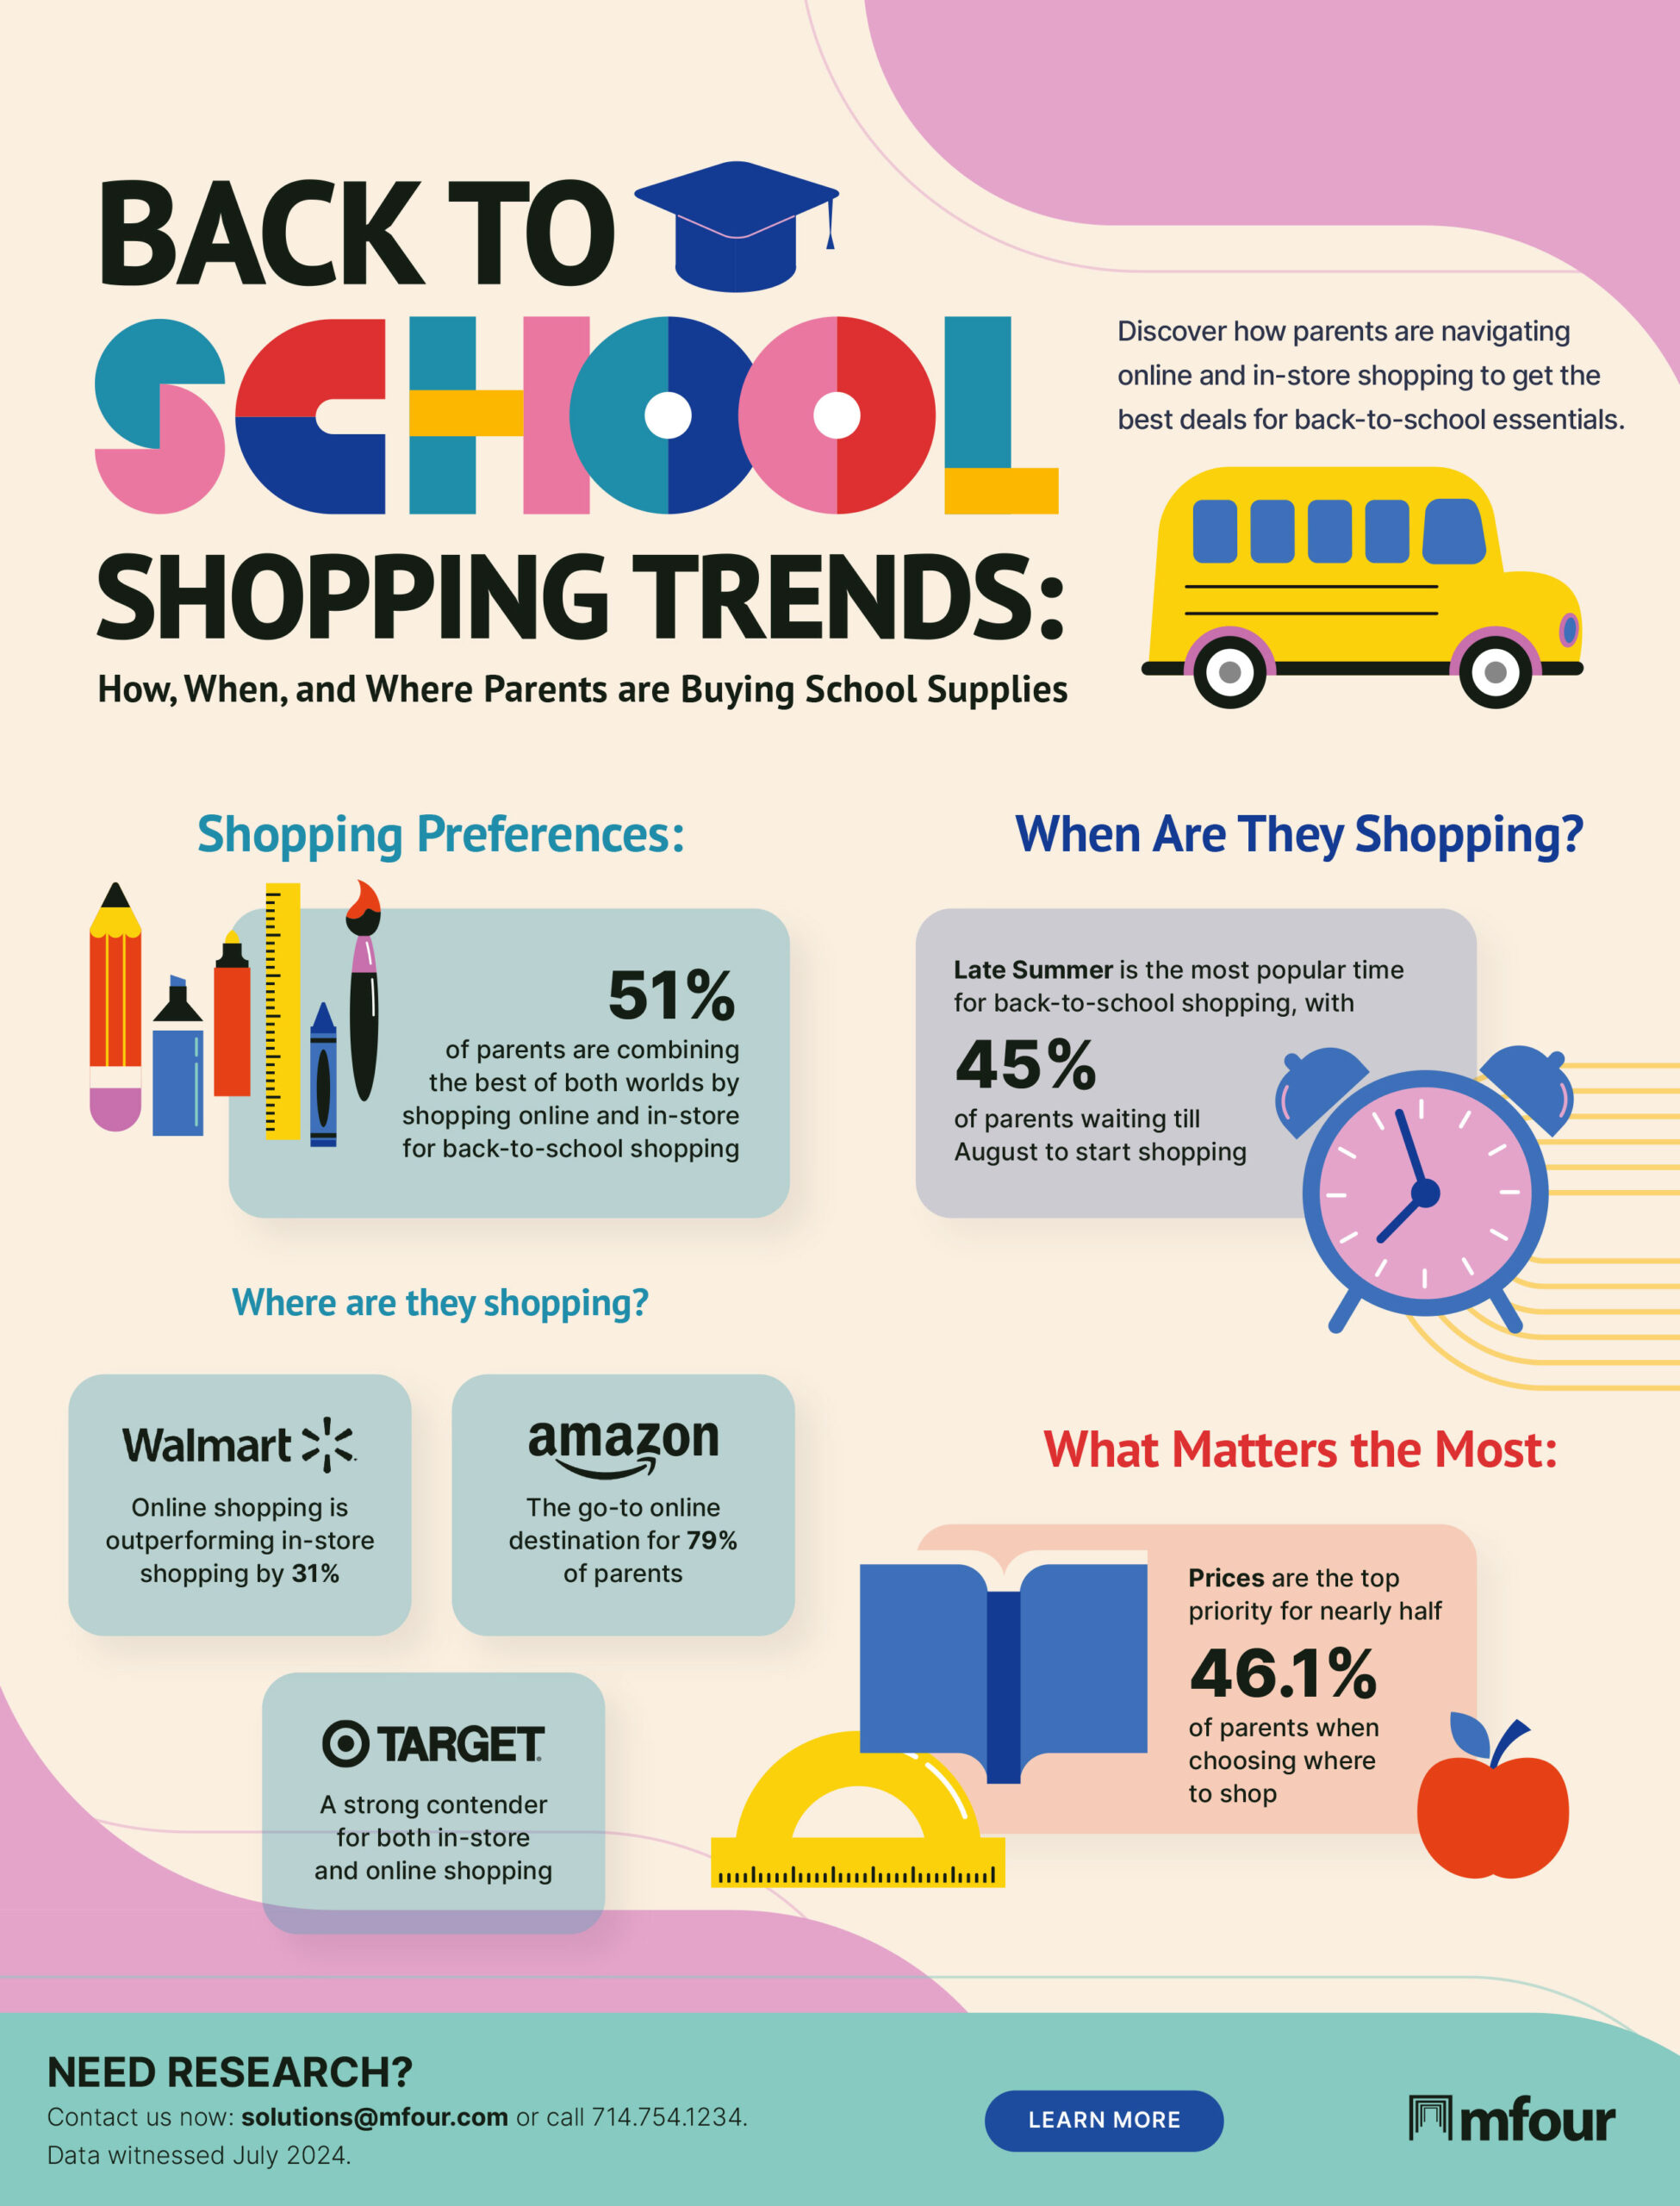
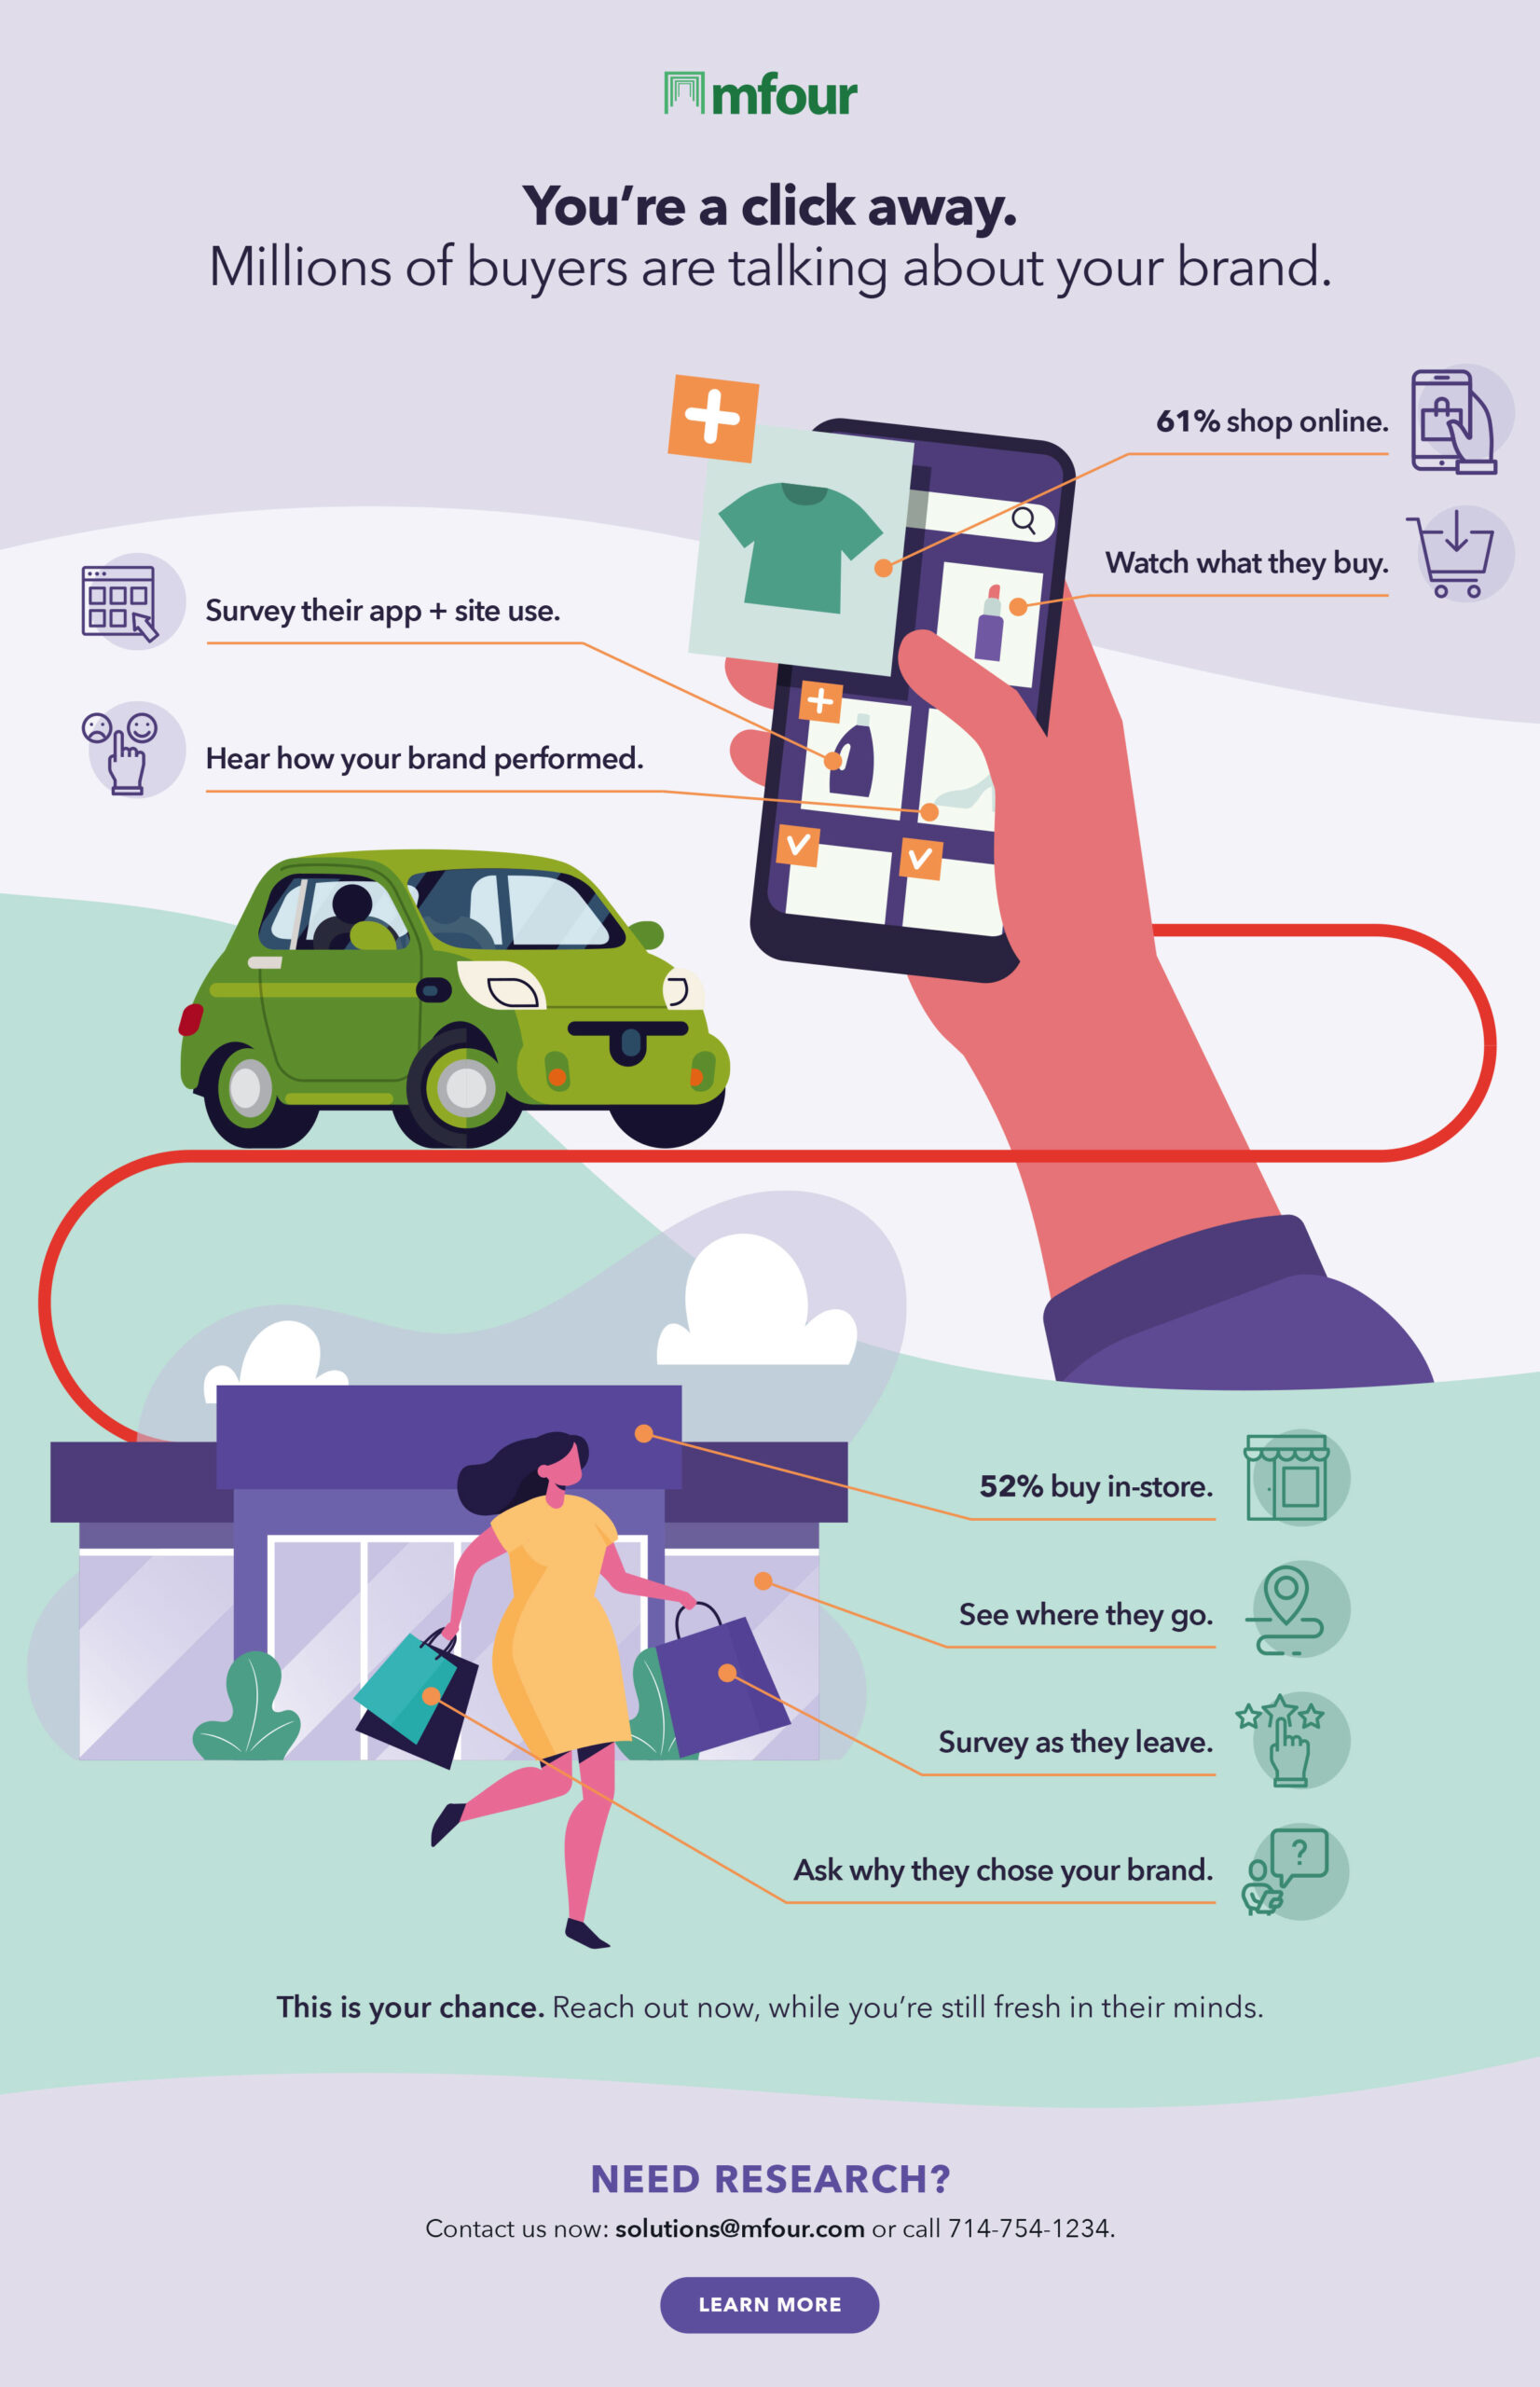
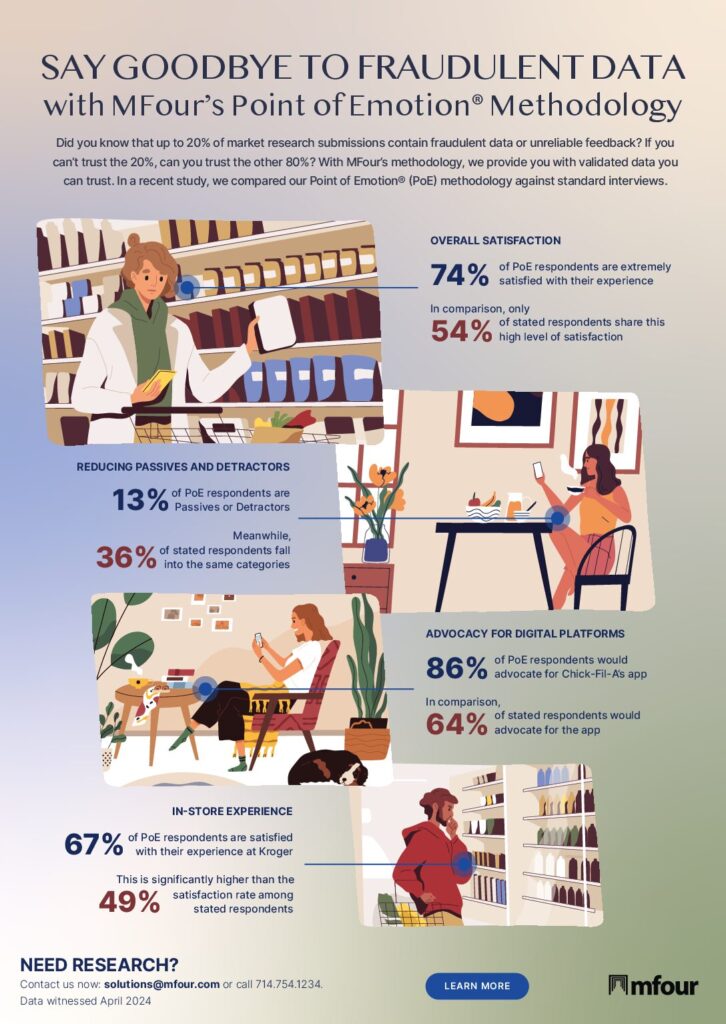
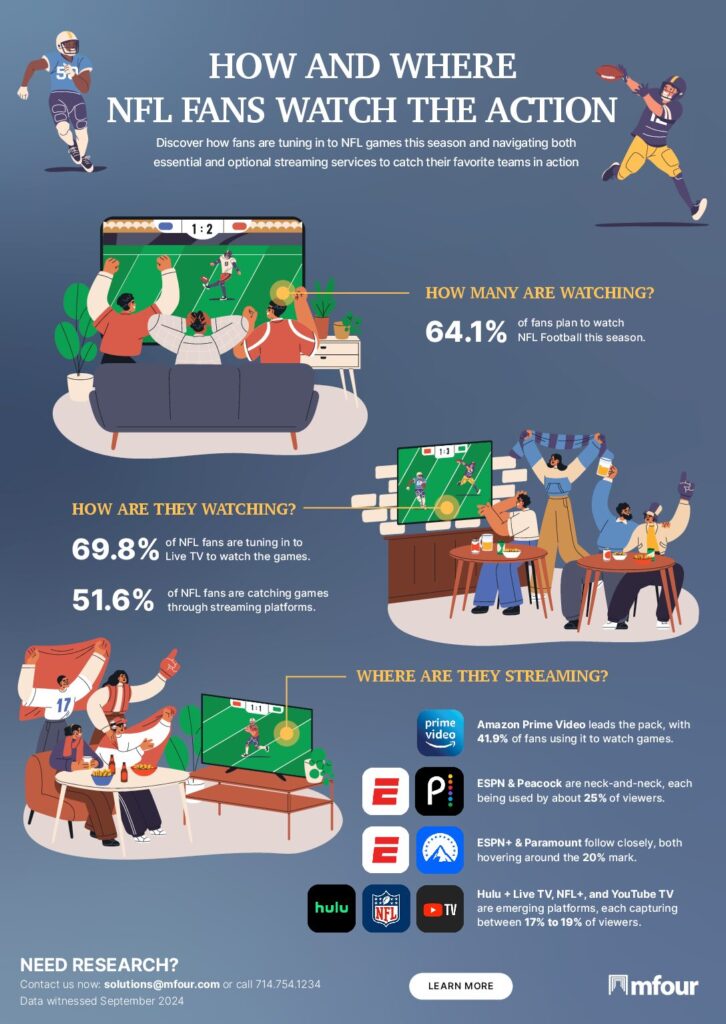
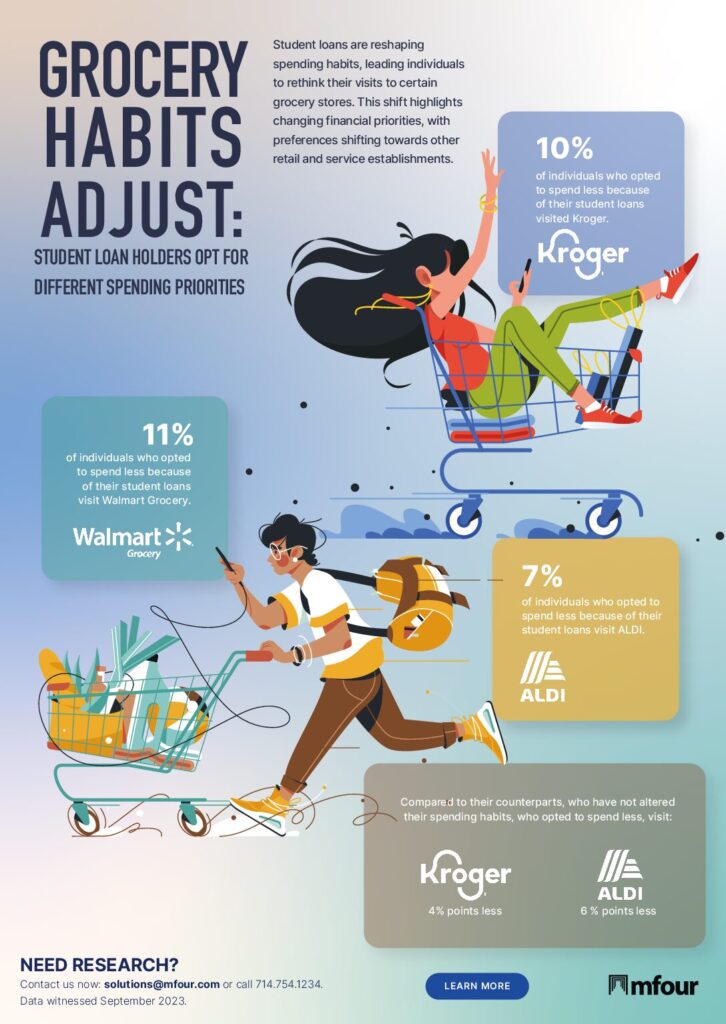
MFour’s SaaS platform generates a large volume of monthly consumer insight data, but much of the research is dense and difficult for a broader audience to quickly understand. The marketing team needed a way to translate these insights into content that was engaging, easy to digest, and visually compelling while still showcasing the value of the data and the capabilities of the MFour platform.
PROCESS
I collaborated with the marketing and research teams to develop quarterly questions for our consumer panel, ensuring each topic was seasonal, timely, and relevant to our audience. I conducted additional research to identify emerging trends and key areas of consumer interest.
Partnering closely with the research team, I distilled complex data into key insights and used AI tools like ChatGPT to turn survey results into clear, engaging copy, translating them into accessible visual narratives.
SOLUTION
The final infographics transformed dense research into visually engaging content that could be quickly consumed by our audience. These assets were used in weekly email campaigns and as gated content on the website, helping increase click-through rates and overall engagement. The gated infographics also supported lead generation by capturing new email contacts and contributing to growth in the sales pipeline.
As part of the infographic creation process, I actively researched current events and cultural trends to develop relevant and timely topics for consumer surveys. Working closely with the research team, I helped craft and review questionnaire elements (QREs) to ensure questions were clear, engaging, and aligned with the intended narrative. This collaborative approach ensured we gathered meaningful data from survey participants, setting the foundation for compelling insights and well-informed visual storytelling.
The infographics created from consumer research insights were repurposed into animated email campaigns to boost engagement and shareability. Key data points and visuals were brought to life through motion, helping to guide the reader’s attention and make the content more dynamic and digestible. These animations not only enhanced the storytelling but also improved click-through rates by providing a more interactive and visually compelling experience for the audience.